A few days ago I came across a thread by @phosphenq about a university student who trained an AI model on 95,491 professional tennis matches spanning 43 years. The model achieved 85% accuracy and correctly predicted the Australian Open 2025 champion before the first ball was hit.
The approach was elegant: build a custom ELO rating system adapted from chess, engineer dozens of derived features from raw match data, and let XGBoost, a gradient-boosted tree algorithm, learn which patterns separate winners from losers.
I wanted to see if the same methodology could work for football. Specifically, for the Greek Super League.
Football is fundamentally harder than tennis for prediction. Tennis has two outcomes (player A or player B wins), football has three (Home win, Draw, Away win). Draws happen roughly 25% of the time and are notoriously difficult to predict, they cluster in the middle of every feature distribution with no clean signal to grab onto.
Still, I wanted to try, since in the process I would have learn a tone of things.
ELO Rating
When I first learned about the ELO rating I assumed it was an acronym. It's not (!), it's named after Arpad Elo, a Hungarian-American physics professor and chess master who proposed the system in 1960 to rank chess players.
The idea is simple: every player has a numerical rating. When two players compete, the outcome updates both ratings. The size of the update depends on how surprising the result was. If a strong player beats a weak one, ratings barely move, that was expected. If the weak player pulls off an upset, both ratings shift significantly.
The system has two parts. First, you calculate the expected score for each player based on the rating difference:
Where and are the current ratings of player A and player B. The expected score is a number between 0 and 1 representing the probability that player A wins. Player B's expected score is simply .
Then, after the match, you update the ratings:
Where is the actual score (1 for a win, 0.5 for a draw, 0 for a loss) and is the K-factor, a constant that controls how much ratings change per match. A higher K means ratings react faster to recent results; a lower K makes them more stable.
A Concrete Example
Say PAOK (rated 1793) plays at home against Levadeiakos (rated 1569). The rating difference is 224 points.
Step 1. Expected scores:
So the ELO system gives PAOK a 78.4% chance of winning.
Step 2. Update after the match:
Using K = 32 (a common choice), if PAOK wins ():
PAOK gains only ~7 points because the win was expected. But if Levadeiakos pulled off the upset:
An upset win moves ratings 3.6x more than an expected one, this is the self-correcting mechanism that makes ELO so effective.
The Data
I collected CSV files from football-data.co.uk covering 20 seasons of Greek Super League football, from 2004-2005 through 2025-2026. That gave me 4,611 matches across 37 teams.
Each CSV contains match results, half-time scores, shots, shots on target, corners, cards, fouls, and betting odds from multiple bookmakers (Bet365, Pinnacle, market average, etc.).
The result distribution across the dataset:
- Home wins: 2,161 (47%)
- Away wins: 1,267 (27%)
- Draws: 1,183 (26%)
Home advantage is real and significant, teams win at home almost twice as often as they win away. Richard Pollar has wrote about it.
Part I: The ELO Rating System
Following the tennis model's approach, I started by building an ELO rating system, instead of players I used the teams. Every team starts at 1500. Win a match and your rating goes up, lose and it goes down. The key mechanic: the amount you gain or lose depends on the rating gap between you and your opponent. Beating a higher-rated team gives you more points than beating a weaker one.
I also built a goal-weighted ELO variant where the K-factor (how much ratings change) scales with the margin of victory. A 4-0 thrashing moves ratings more than a 1-0 scrape, using a logarithmic multiplier on the goal difference.
The final ELO rankings match what every Greek football fan would expect:
| Team | ELO Rating |
|---|---|
| Olympiakos | 1854 |
| PAOK | 1793 |
| AEK | 1787 |
| Panathinaikos | 1754 |
| Aris | 1624 |
PAOK's ELO Journey
I plotted PAOK's rating across all 604 matches in the dataset:
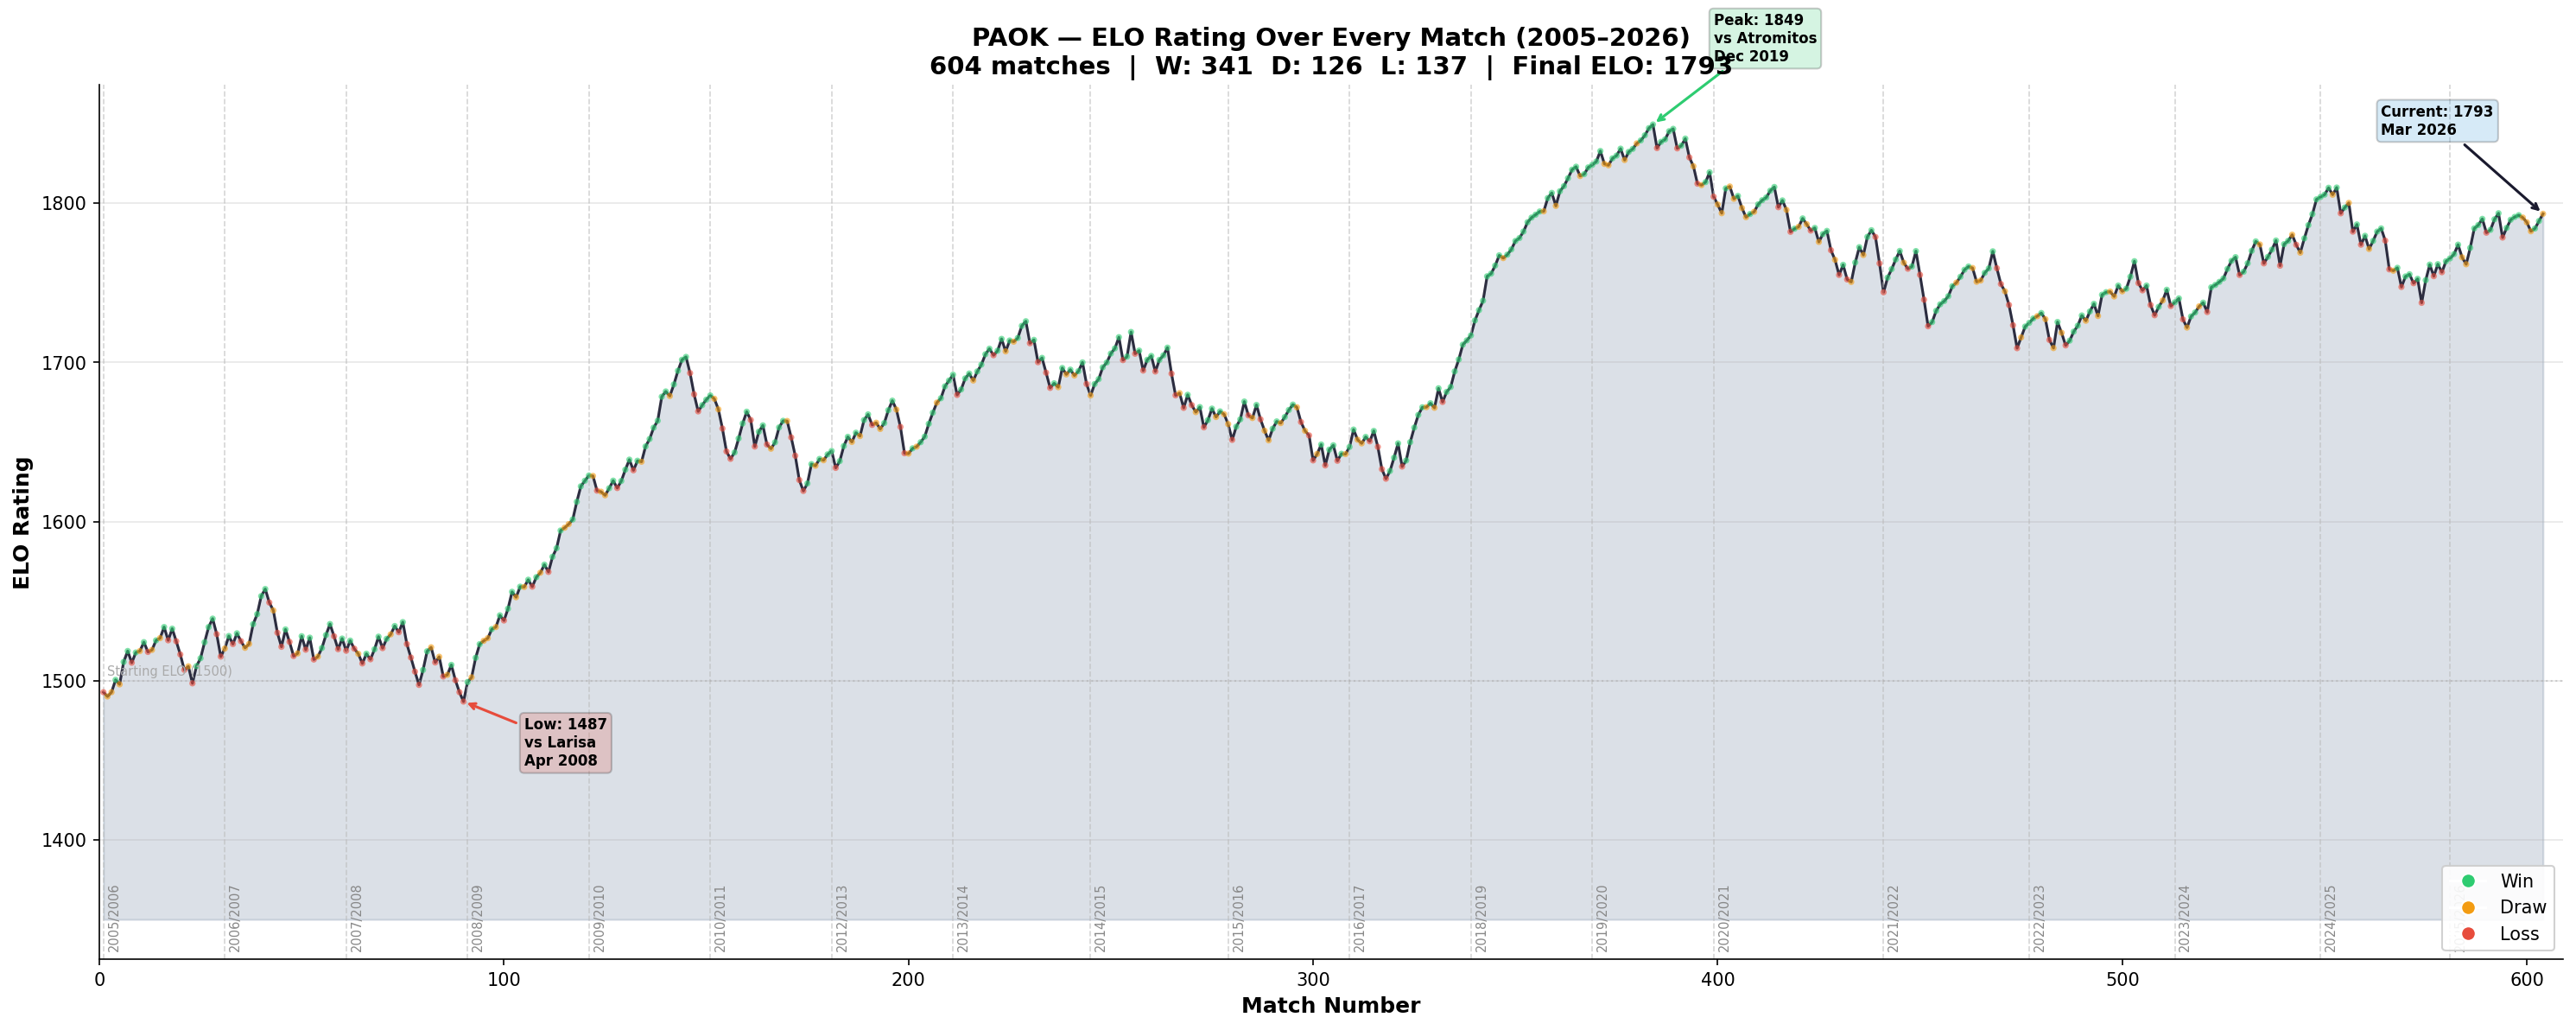
The curve tells PAOK's story. You can see the early years hovering around 1500, the steady climb through the 2010s, the peak at 1849 during the 2019 championship era, a dip, and the current strong form at 1793.
Each dot is colored by result, green for wins, orange for draws, red for losses. The clusters of green during the peak years and the occasional red dips during slumps are all visible.
The Greek "Big Four"
When you overlay every team's ELO on one chart, the class structure of Greek football becomes mathematically visible:
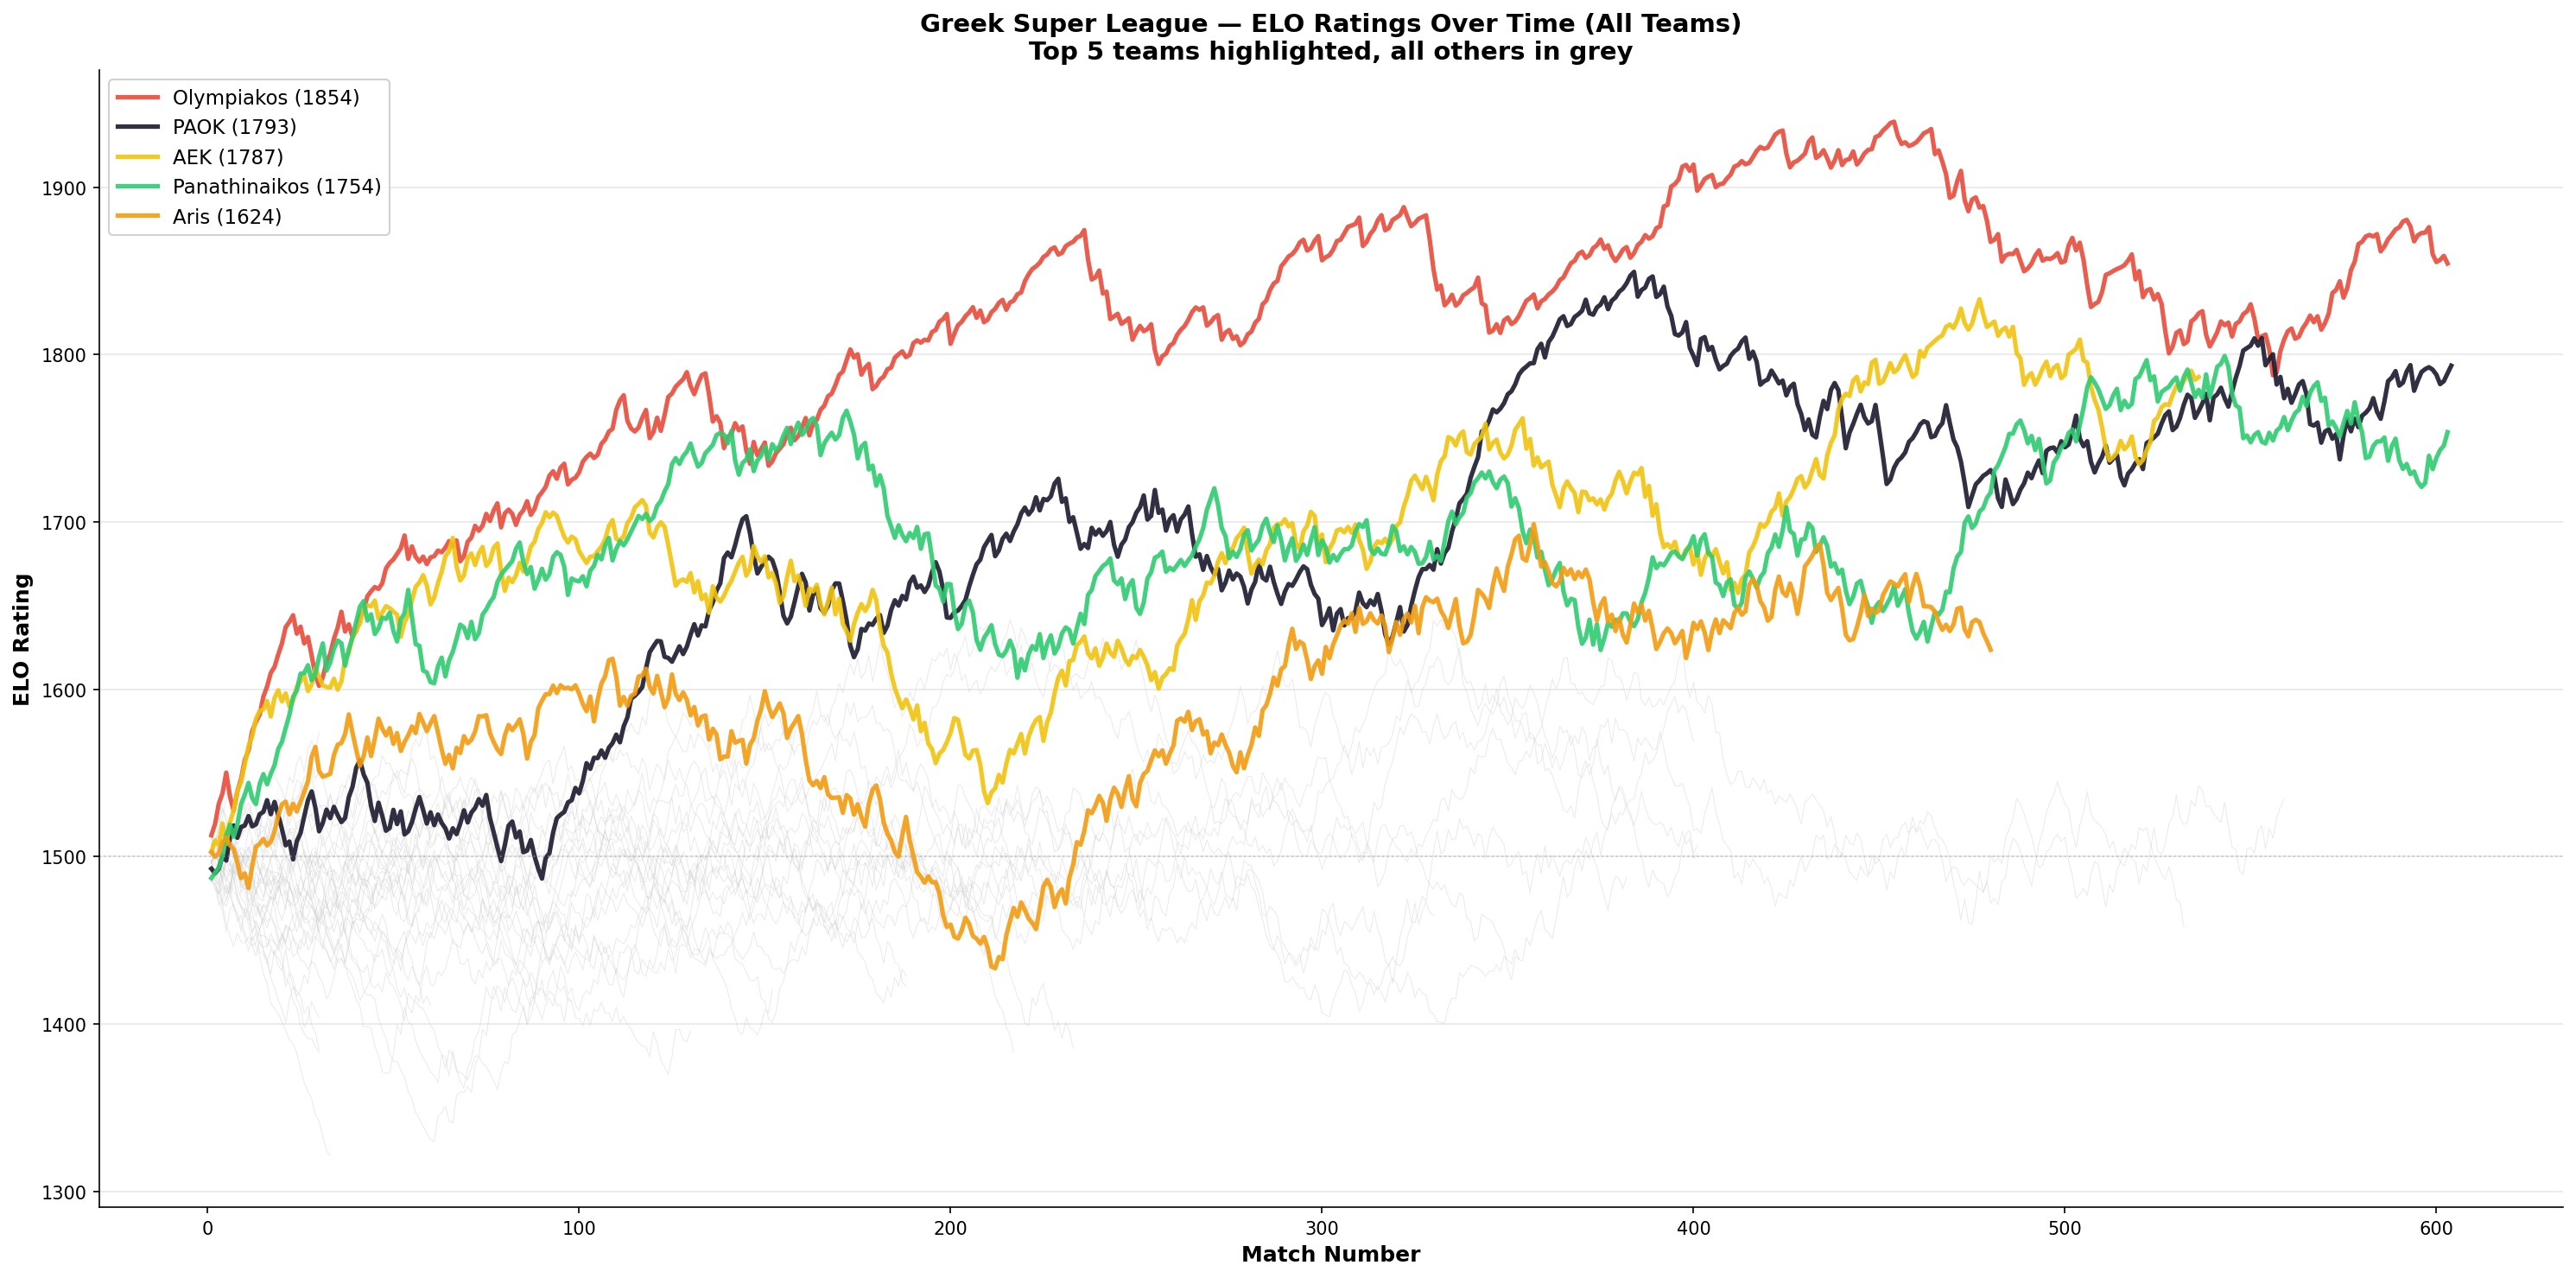
Olympiakos (red), PAOK (black), AEK (yellow), and Panathinaikos (green) tower above every other team that has played in the league over the past 20 years. Everyone else in grey sits well below. The "Big Four" isn't a narrative, it's a mathematical fact derived from two decades of results.
Part II: Feature Engineering
Raw match data and ELO ratings alone only get you so far, I deciced to add extra features.
ELO Features
Standard ELO and goal-weighted ELO for both teams, plus the difference and total.
Rolling Form, 5 & 10 Match Windows
For each team: average goals scored, goals conceded, points per game, shots, and shots on target over their last 5 and last 10 matches.
Head-to-Head Record
The last 5 meetings between the two specific teams: wins for each side, draws, and the home team's win rate.
Goals-Derived Features
- Clean sheet rate: percentage of games with zero goals conceded
- Scoring consistency: standard deviation of goals scored (is the team steady at 1-1 or volatile between 0-0 and 4-2?)
- Second half goal ratio: do they score early or late?
- Comeback rate: how often does the team win after trailing at half-time?
- Both teams to score rate: from last 10 matches
Temporal Features
- Momentum streak: consecutive wins (+N) or losses (-N)
- Season stage: how many matches played in the current season
- League position proxy: points per game and goal difference in the current season
Advanced Derived Features
- Poisson expected goals: using each team's scoring and conceding averages to estimate likely goals in the match
- Attack vs defence mismatch: home team's attack strength versus away team's defensive record
- Form trajectory: is the team improving or declining? (slope of recent results via linear regression)
- Upset tendency: how often the team beats higher-ELO opponents
- Home advantage strength: per-team home vs away performance gap
Match Stats Features
- Shot conversion rate: goals per shot (clinical finishing)
- Shot accuracy: shots on target per total shot (chance quality)
- Corner dominance: corners won as a ratio of total corners in their matches (attacking pressure proxy)
- Discipline index: yellow cards + 3x red cards per game
- Foul rate: fouls committed per game
Exponential Decay Form
Instead of flat averages where match 1 and match 10 count equally, I applied exponential decay weighting (factor 0.85) so the most recent matches contribute the most. This captures momentum better than simple averages.
Unbeaten Run & Schedule Congestion
- Unbeaten run: consecutive matches without a loss
- Schedule congestion: number of matches played in the last 14 and 21 days
Betting Odds
Bookmaker odds converted to implied probabilities (removing the overround), plus derived features like the probability gap between home and away, bookmaker consensus, and over/under 2.5 goals probability.
Part III: The Variable That Splits Winners From Losers
Before fitting any model, I plotted every feature against every other feature in an SNS pairplot, looking for separation between the three outcome classes:
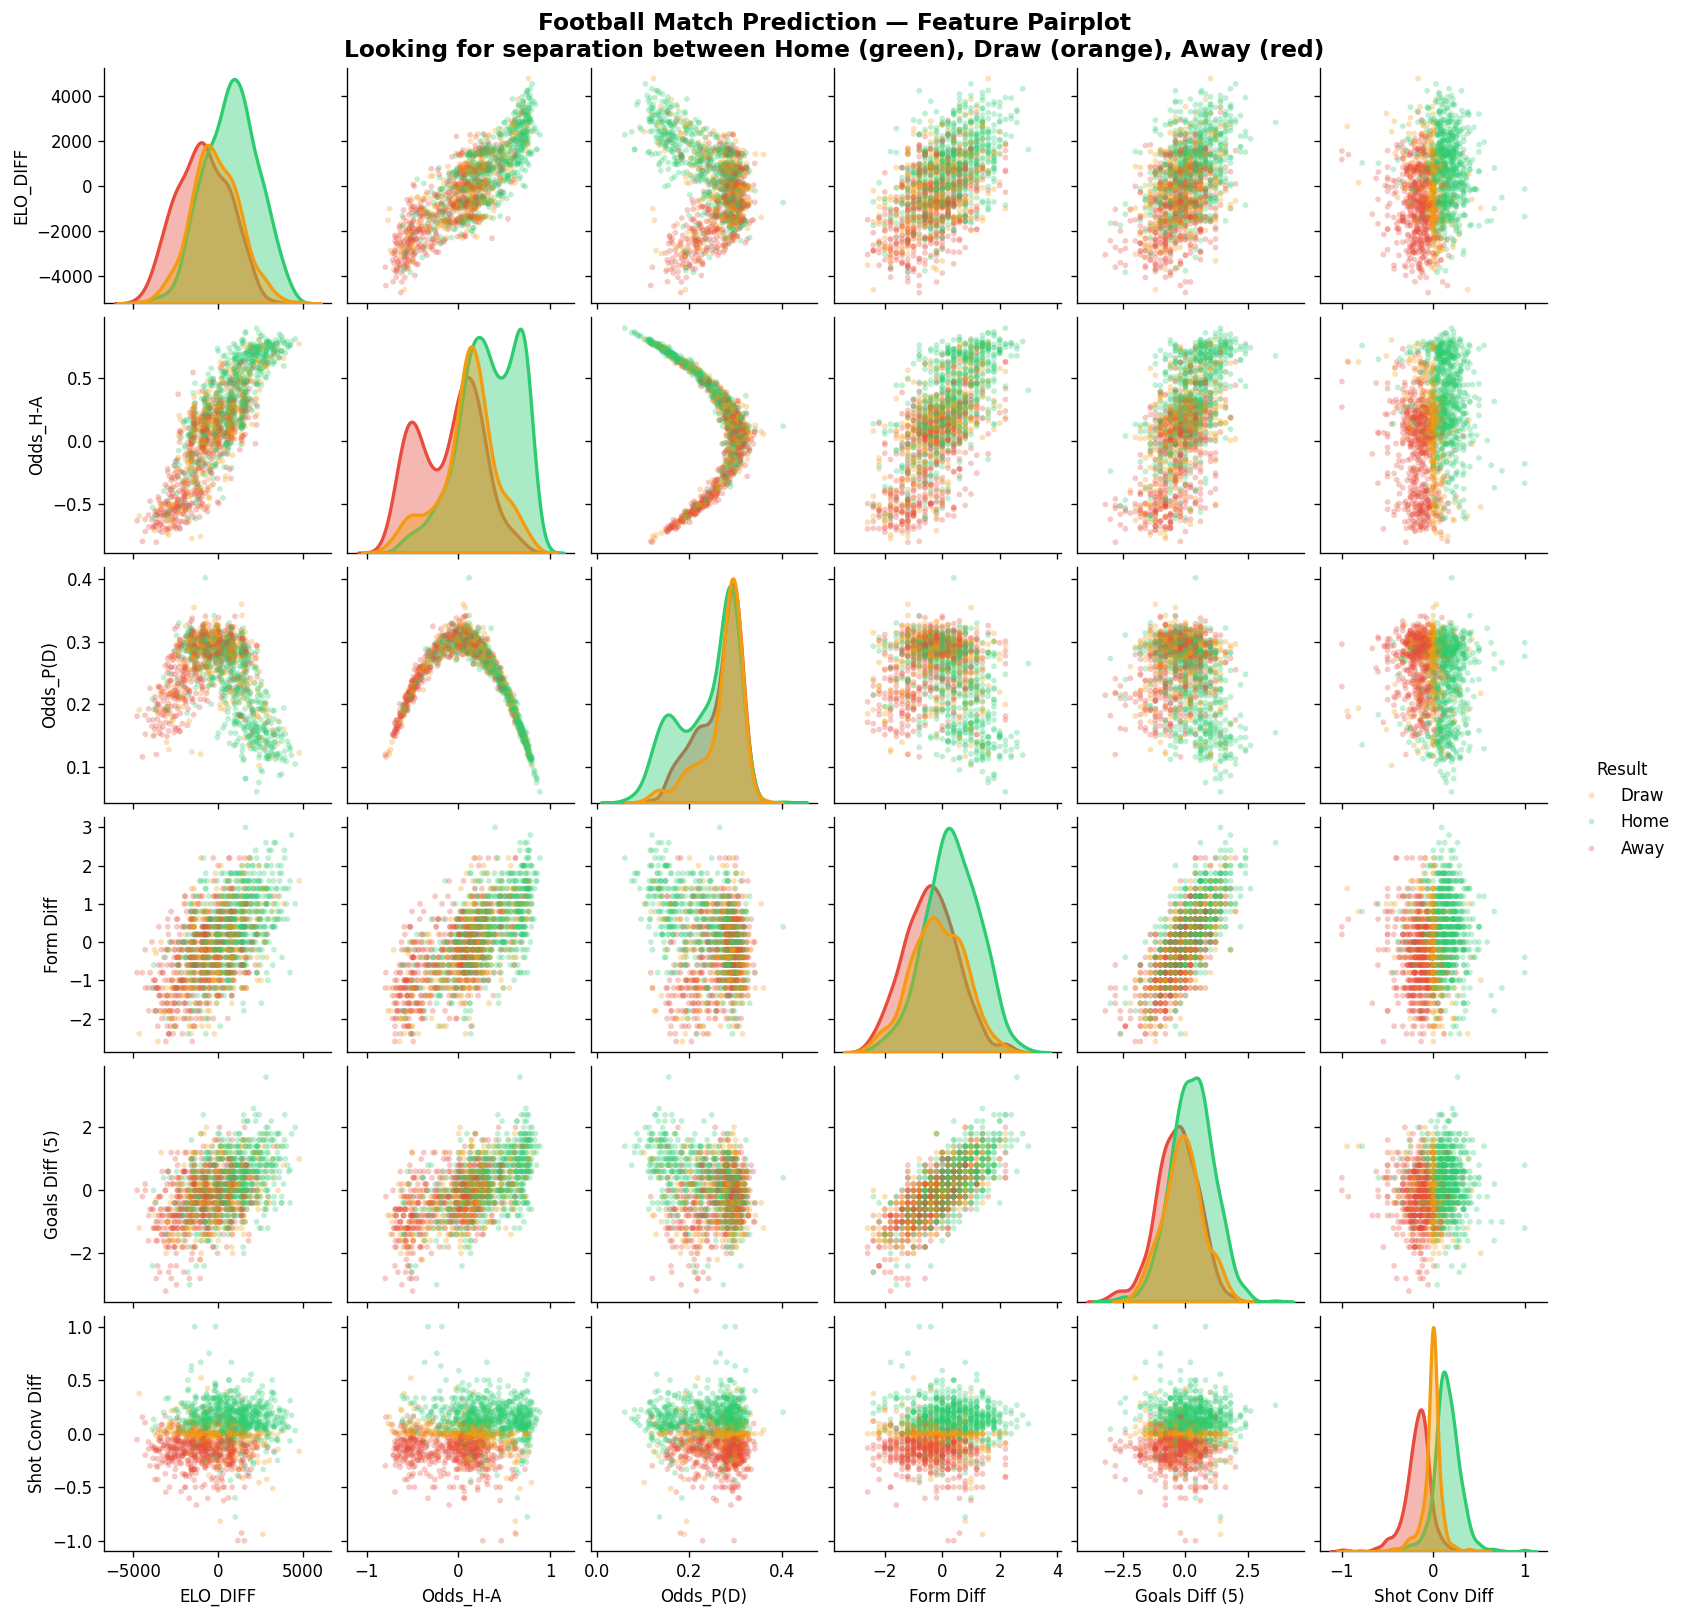
Most features show heavy overlap between the classes, football is noisy and that the beauty!. But two features stood out: ELO Diff and Odds H-A (home vs away probability difference) show the clearest separation between home wins (green) and away wins (red), with draws (orange) frustratingly scattered across both distributions.
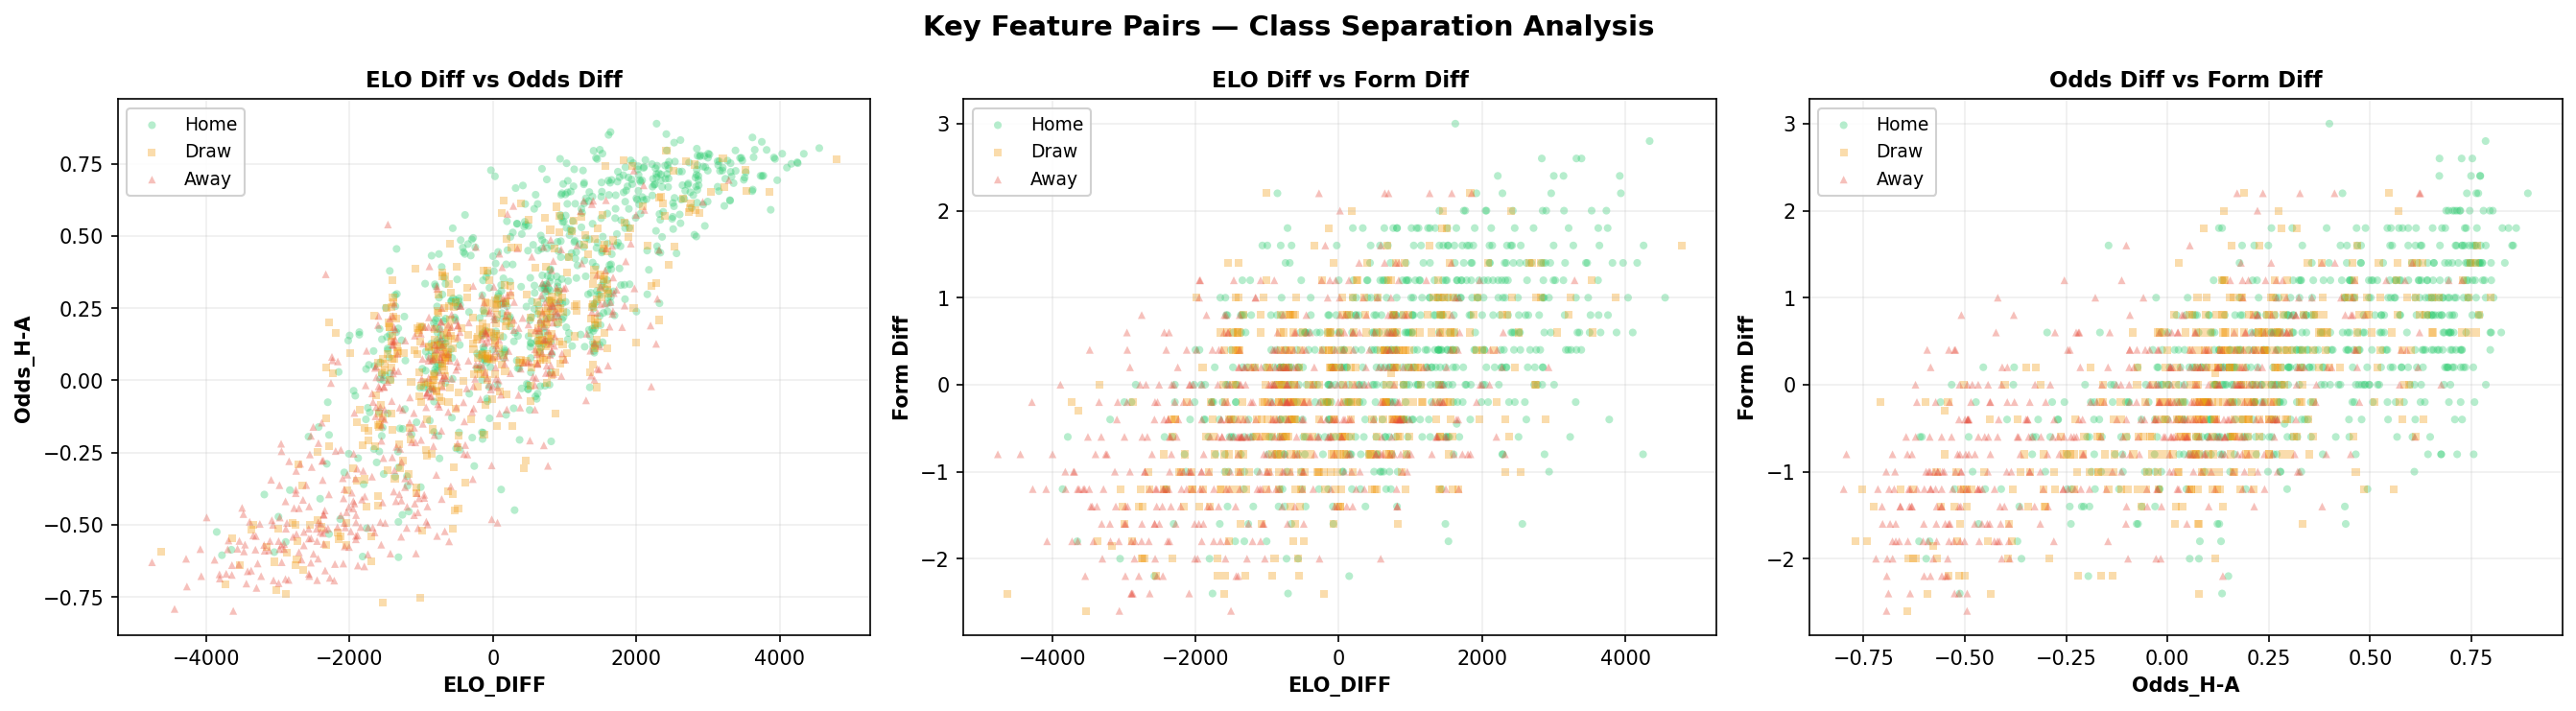
The ELO Diff vs Odds Diff scatter shows strong correlation, bookmakers and our ELO system largely agree. But the scatter around that line is where the model finds edge.
Part IV: From Decision Tree to CatBoost
Following the same progression as the tennis model, I tried increasingly powerful algorithms:
| Model | Accuracy |
|---|---|
| Decision Tree | 50.0% |
| Random Forest (100 trees) | 56.5% |
| Odds Favourite (baseline) | 54.8% |
| XGBoost | 58.3% |
| CatBoost | 66.1% |
The decision tree barely beats random guessing. Random Forest improves by combining many trees. XGBoost, which builds trees sequentially where each new tree specifically corrects the mistakes of the previous ones jumps to 58.3%.
But the winner turned out to be CatBoost, another gradient-boosted tree algorithm developed by Yandex. I ran a massive hyperparameter search over 500 configurations across CatBoost, XGBoost, LightGBM, SVM, neural networks, and various ensemble strategies and the best CatBoost config reached 66.1%, beating XGBoost by nearly 8 percentage points.
The winning config uses Bayesian bootstrap with a low temperature (0.4), shallow trees (depth 4), a slightly higher learning rate (0.06), and strong L2 regularization (5.0). CatBoost's ordered boosting reduces overfitting on smaller datasets like ours (1,429 training matches), and it handles NaN values natively, which matters since older seasons lack some stats columns.
I also tested LightGBM (best: 58.3%), neural networks (best: 58.9%), SVMs (best: 58.9%), sklearn's HistGradientBoosting (best: 57.1%), and ensemble strategies including voting, weighted blending, stacking, and multi-seed averaging. None beat the single tuned CatBoost.
Simply picking whoever the bookmaker has as favourite gives 54.8%. Our best model beats the bookmaker baseline by 11.3 percentage points.
Feature Importance
The models identified these as the most predictive features:
| Feature | Importance |
|---|---|
| Avg Odds P(H) | 0.061 |
| Odds Prob Diff (H-A) | 0.043 |
| Avg Odds P(A) | 0.033 |
| Goal-Weighted ELO Diff | 0.019 |
| Corner Dominance Diff | 0.018 |
| Odds Draw Prob | 0.017 |
| ELO Diff | 0.013 |
| Poisson xG Diff | 0.010 |
| Shot Conversion Diff | 0.009 |
Betting odds dominate, they encode the market's collective wisdom about team strength, form, injuries, and everything else. But our engineered features (ELO, Poisson xG, corner dominance, shot conversion) contribute signal on top of the odds that the model uses to outperform the simple "pick the favourite" strategy.
Per-Class Performance (CatBoost)
Before looking at the numbers, a quick refresher on the metrics:
- Precision: "Of all the matches the model predicted as this outcome, what fraction were actually correct?" High precision means few false alarms.
- Recall: "Of all the matches that truly had this outcome, what fraction did the model correctly identify?" High recall means the model misses few of them.
| Outcome | Precision | Recall |
|---|---|---|
| Away Win | 61% | 80% |
| Draw | 60% | 21% |
| Home Win | 71% | 82% |
Draws remain the hardest to predict, only 21% recall. But when the model does predict a draw, it's right 60% of the time, a huge improvement over XGBoost's 38% draw precision. Home wins are the most reliable at 82% recall and 71% precision. Away wins are predicted with 80% recall.
Concretely for draws:
- 21% recall means: out of all matches that were actually draws, the model correctly labeled only about one in five as "draw" (it calls most real draws home/away wins instead).
- 60% precision means: out of all matches where the model predicted "draw", about three out of five really were draws (when it dares to say draw, it's usually right).
Part V: Confidence Thresholds.
Not all predictions are created equal. A 55% confidence prediction is very different from an 88% one. I analyzed how accuracy changes at different confidence thresholds for each outcome class separately:
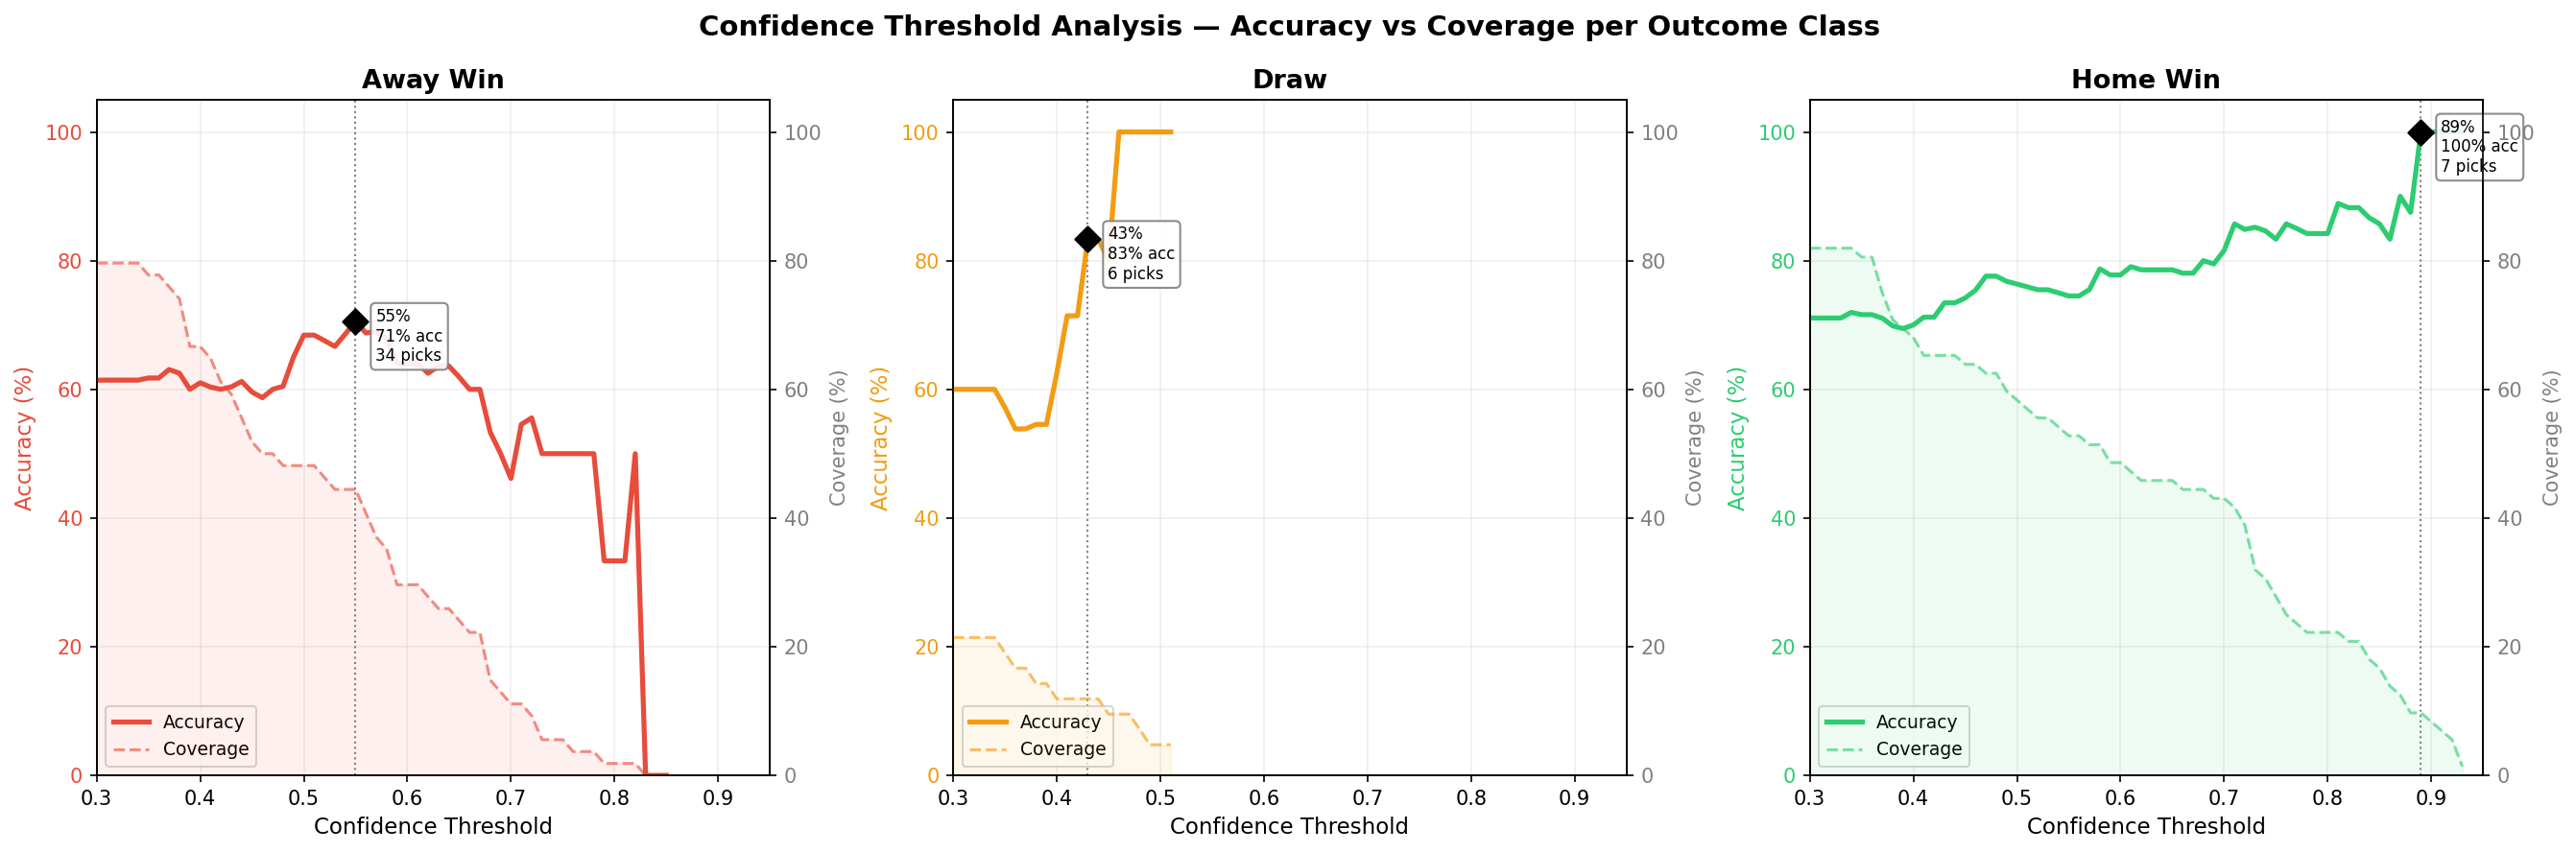
Each chart shows two lines for one outcome class. The solid line is accuracy: "if I only trust predictions above this confidence level, what percentage do I get right?" The dashed line is coverage: "what percentage of actual outcomes of this type would I catch?" As you move the threshold to the right, accuracy generally goes up (you're being pickier) but coverage drops (you're skipping more matches). The sweet spot is where accuracy is high enough to be useful without coverage collapsing to zero.
The optimal threshold is very different per class:
| Outcome | Threshold | Accuracy | Coverage |
|---|---|---|---|
| Home Win | >= 75% | 83% | 28% |
| Draw | >= 43% | 83% | 12% |
| Away Win | >= 55% | 71% | 44% |
Draws need a much lower threshold because the model rarely goes above 50% confidence on draws. But when it predicts a draw with even 43% confidence, it's right 83% of the time. Home wins need a higher bar, at 75% confidence the model hits 83% accuracy while still catching about a quarter of all home wins. Away wins have the best balance at 55%, catching nearly half of all actual away wins at 71% accuracy.
The tradeoff is clear: higher thresholds mean fewer but more reliable predictions. If you only bet on predictions above these thresholds, you'd make roughly 3-4 picks per matchweek instead of 7, but with significantly higher accuracy.
Part VI: Predicting the Upcoming Matchweek
With the model trained on all data through March 9, 2026, I ran predictions for the upcoming Greek Super League fixtures (March 14-15), this time with actual betting odds included as features:
| Date | Match | Prediction | Confidence | ELO Gap |
|---|---|---|---|---|
| 14.3 | OFI Crete vs Olympiakos | Away Win | 89% | -342 |
| 14.3 | Panserraikos vs Aris | Away Win | 66% | -203 |
| 14.3 | Larisa vs Asteras Tripolis | Draw | 43% | +7 |
| 15.3 | Kifisia vs Volos NFC | Draw | 44% | -19 |
| 15.3 | PAOK vs Levadeiakos | Home Win | 87% | +224 |
| 15.3 | Atromitos vs AEK | Away Win | 73% | -252 |
| 15.3 | Panathinaikos vs Panetolikos | Home Win | 72% | +266 |
The strongest prediction: PAOK to beat Levadeiakos at home with 87% confidence, backed by a 224-point ELO gap and PAOK's strong home record.
The most interesting calls: Larisa vs Asteras Tripolis and Kifisia vs Volos NFC, the model predicts draws in both, with 43% and 44% confidence respectively. These are evenly matched teams where the odds and ELO ratings are close, and the model is picking up on the lack of separation between the sides. Given that our model achieves 60% precision on draw predictions, these are worth watching.
Next
I will use the model to predict the outcome of the games till the end of the season and keep updating the article, and ofcourse will do some fun bets with it.