I have a side-project that I deploy as a Lambda function on AWS. I did everything the documentation tells you to do:
Trimmed the deployment package below 5MB, enabled provisioned concurrency for the critical paths, added a cron that pings the function every five minutes. The cold start times went from 1.5 seconds down to 800ms. That still felt like a lot.
The project is nothing really serious, not a critical business endpoint, rather a side project, but I still wanted to investigate. It became more of an engineering challenge: how far could I bring it down?
A cold start happens when a serverless function is invoked without a warm container already waiting. AWS Lambda has to provision a new container from scratch, initialize the runtime, load the function code, and resolve dependencies, all before execution begins. Only then does the handler run.
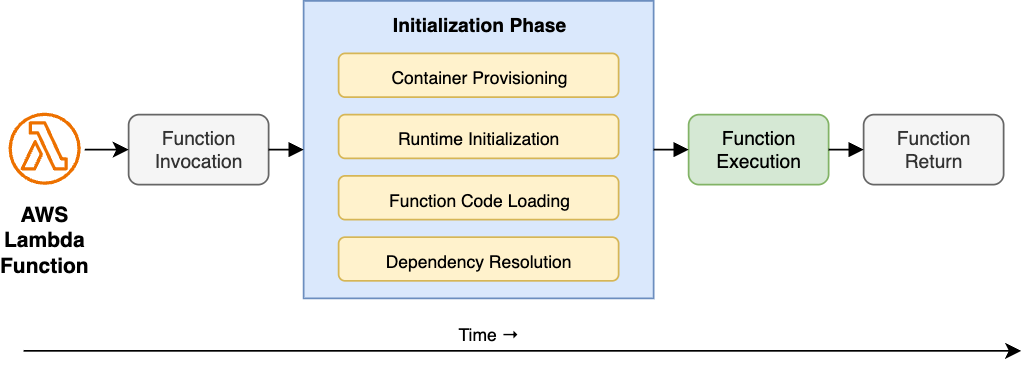
Most cold start advice targets the infrastructure side of that diagram, smaller bundles, provisioned concurrency, prewarming. Certainly there is a lot to look at there, but after applying all of those fixes and still staring at 800ms, I suspected the problem was in the source code, specifically in the "Function Code Loading" and "Dependency Resolution" steps.
When Node.js initializes a Lambda function it doesn't lazily discover the code, it eagerly evaluates every module imported, in dependency order, synchronously. Every import at the top of a file is a blocking operation. Every module that module imports is also blocking. The entire tree resolves before the handler runs a single line.
Some reasons that turn the initialization into a performance penalty:
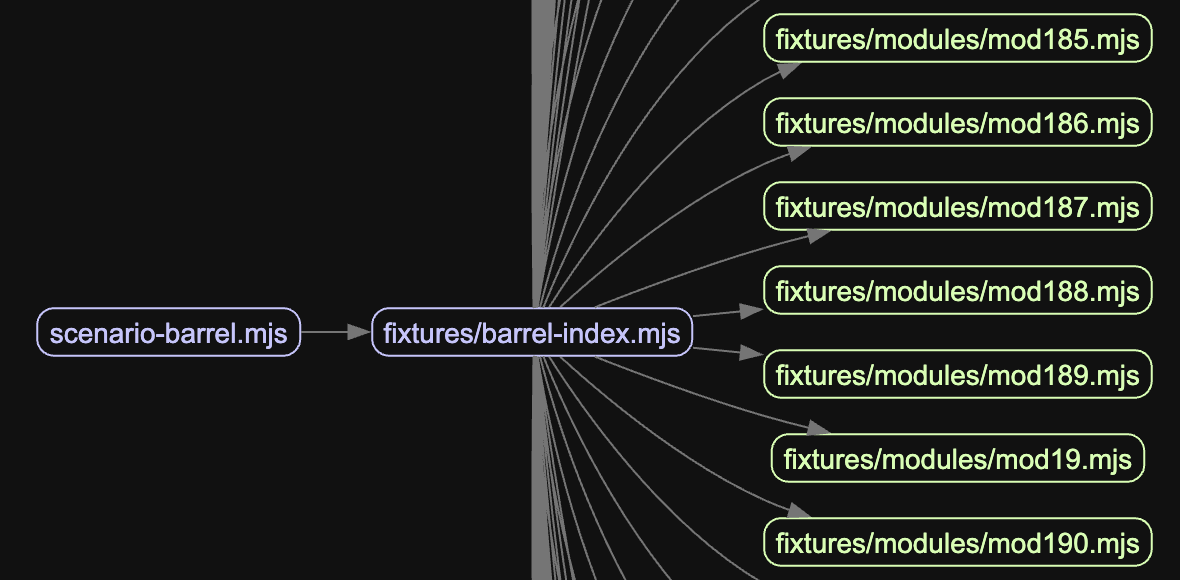
The hidden import chain. A shallow import { thing } from './utils' looks cheap. But if utils imports ./database, which imports pg, which imports pg-types, which imports moment, which imports... a significant portion of the application ends up loaded just to use one utility function. The cost isn't in the import, it's in the chain. Running madge on the barrel scenario from the benchmark makes this concrete:
One heavy package, everyone waits. One heavy package at the edge of the dependency graph can dominate the entire startup time. moment, aws-sdk v2 (the full client), large schema validators, any of these imported at module level will block initialization for their entire parse-and-execute time, even if they're used by 5% of requests.
Import-time side effects. This is the most insidious pattern. Code that runs at module evaluation time, not inside a function, but at the top level of the file:
// This runs when the module is first imported, before the handler is called
const config = JSON.parse(fs.readFileSync('./config.json', 'utf8'));
const client = new DatabaseClient(config.connectionString);
That readFileSync and that constructor are blocking the event loop during cold start. If the database client does anything expensive in its constructor, validation, schema loading, connection pool initialization, it all happens before the function can respond to a single request.
Deploying unbundled code. Uploading a ZIP with a full node_modules directory instead of a single bundled file means Node.js has to resolve and read potentially thousands of individual files from disk during cold start. A bundler like esbuild collapses the entire dependency graph into one file, so Lambda reads one thing off disk instead of traversing a directory tree. The difference in file I/O alone can add hundreds of milliseconds on a cold container where the filesystem cache is empty.
To put numbers to this, I built a local benchmark that spawns each scenario as a fresh process, simulating a real cold start, and measures wall time from spawn to first handler output, 50 runs each. These run on a local machine, so the absolute values are not representative of Lambda, Node.js process startup alone accounts for most of the baseline. What matters is the relative difference between scenarios:
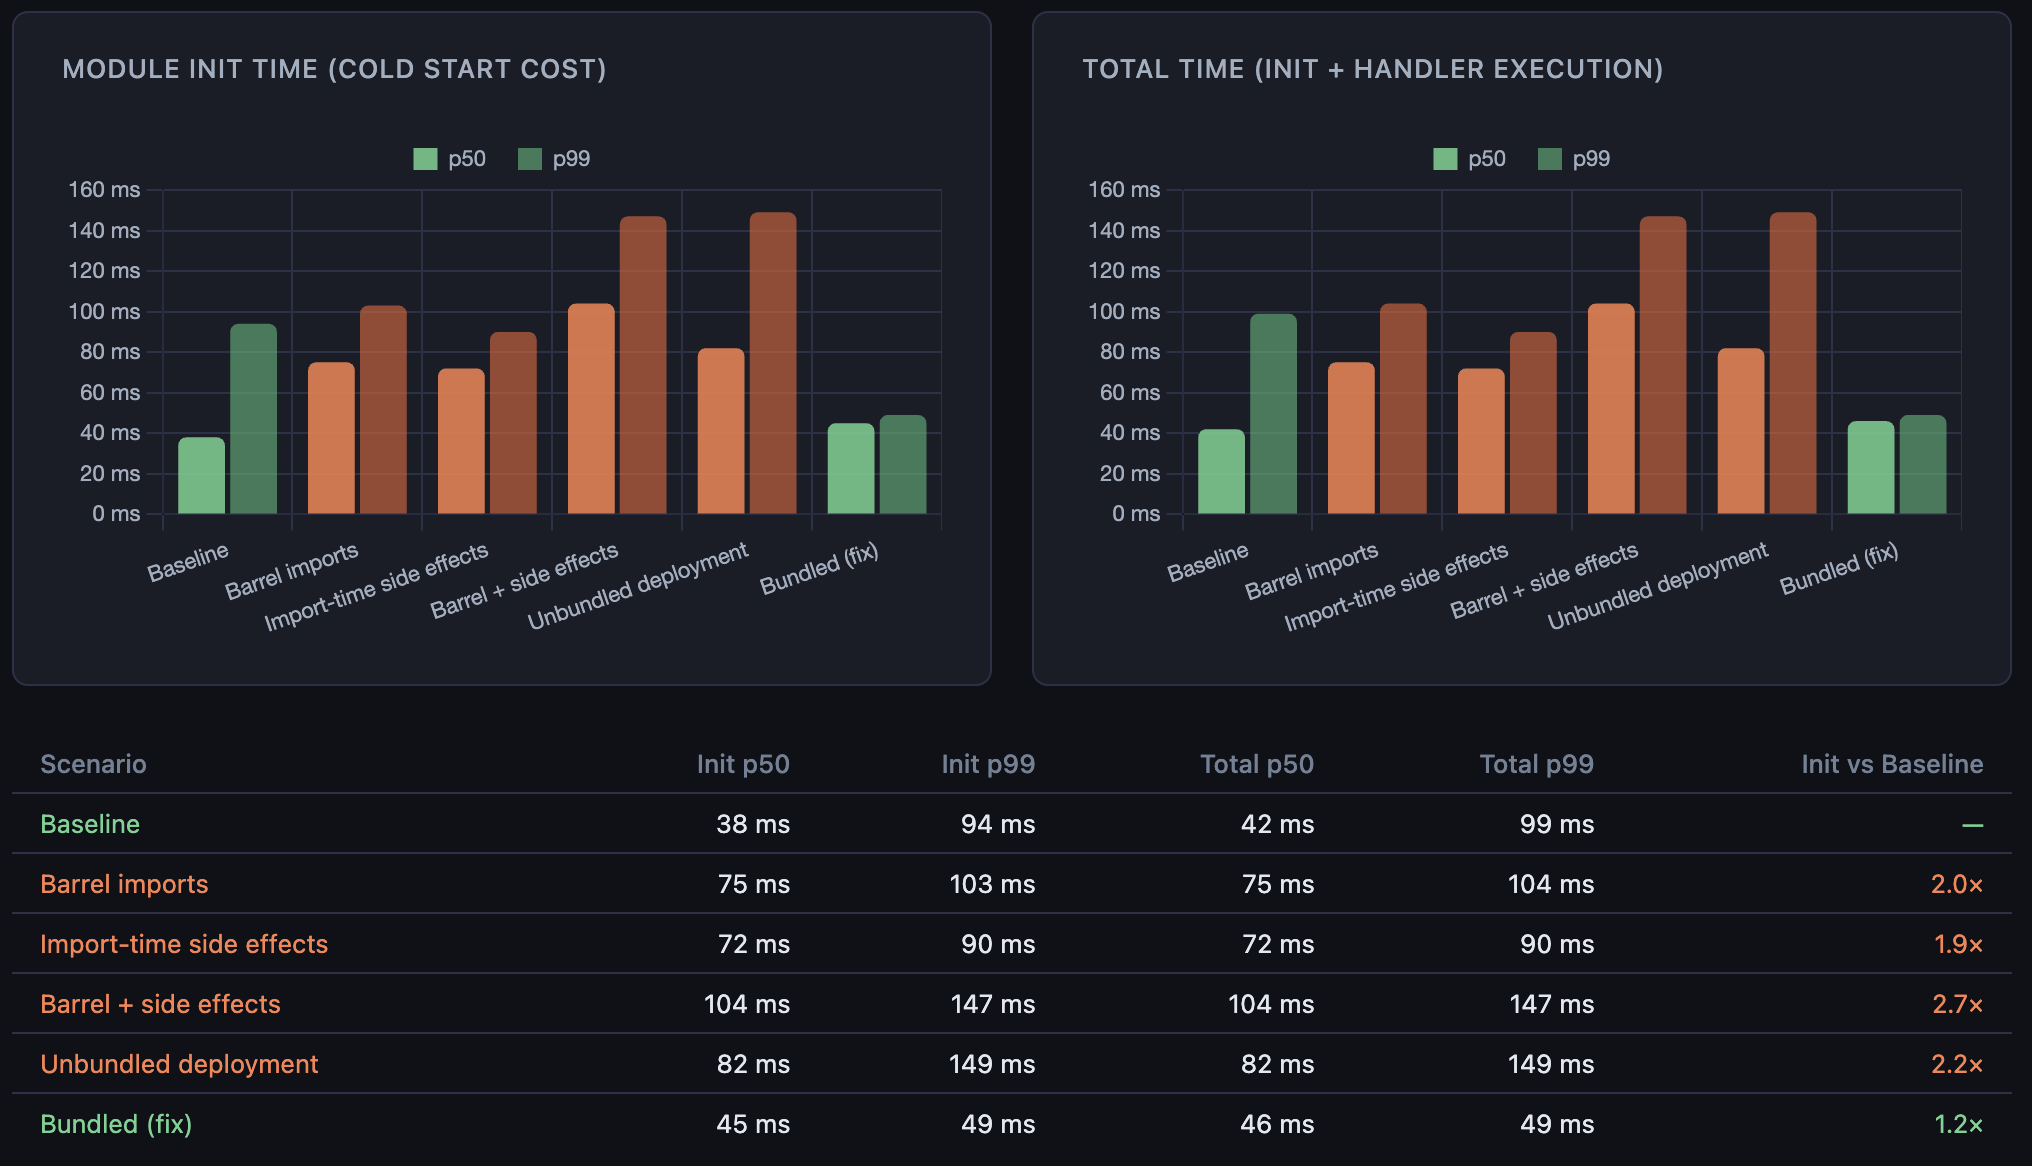
The left panel is the cold start tax paid before the handler runs. The right panel is total time. Each anti-pattern roughly doubles or more the init time compared to baseline. The bundled fix brings it back down to near-baseline, showing that the same 800 exports loaded from a single file cost almost nothing compared to resolving them across 800 separate paths.
What I changed
Each of these patterns has the same fix applied at a different level: defer work until it is actually needed.
For the hidden import chain, the first move is to check what's actually being pulled in. madge can generate a visual dependency graph from the entry point. For timing specifically, running Node.js with --trace-event-categories node.module_timer produces a Chrome-compatible trace that shows how long each CommonJS module takes to load. For ESM there is no equivalent built-in tracer, so wrapping dynamic imports with performance.now() is the practical alternative. Once the chain is visible, the refactoring is usually obvious: split a large utils module into focused files so callers only import what they use.
For the heavy package problem, the solution is lazy imports. Instead of loading aws-sdk at module level, load it inside the function that uses it:
// Before: loaded on every cold start, used rarely
import { S3Client } from '@aws-sdk/client-s3';

export async function handler(event: Event) {
  if (event.type === 'export') {
    const s3 = new S3Client({});
    // ...
  }
}
// After: only loaded when the export path is actually hit
export async function handler(event: Event) {
if (event.type === 'export') {
const { S3Client } = await import('@aws-sdk/client-s3');
const s3 = new S3Client({});
// ...
}
}The dynamic import() is async and deferred, it won't block the cold start path.
For import-time side effects, the fix is to move initialization inside the handler or behind a lazy singleton:
// Before: runs at module load time
const client = new DatabaseClient(process.env.DATABASE_URL!);

export async function handler(event: Event) {
  return client.query('SELECT 1');
}
// After: initialized on first invocation, reused on subsequent warm invocations
let client: DatabaseClient | undefined;
function getClient(): DatabaseClient {
if (!client) {
client = new DatabaseClient(process.env.DATABASE_URL!);
}
return client;
}
export async function handler(event: Event) {
return getClient().query('SELECT 1');
}This pattern works correctly in Lambda's single-threaded execution model, where only one request runs at a time per container, so there is no race between concurrent callers. The client is initialized once per container lifetime and reused across warm invocations. Connection reuse is preserved; the initialization cost is just moved out of the critical path.
For unbundled deployments, the fix is to add esbuild to the build step and deploy a single output file. It's easy to skip when deploying manually or with a simple zip script. The resulting bundle also tends to be significantly smaller than a zipped node_modules, which helps with the S3 download step during container provisioning.
The thing prewarming can't fix
Provisioned concurrency tells AWS to keep a set number of Lambda containers initialized and ready to handle requests at all times. Without it, the first request after a period of inactivity triggers a cold start. With it, requests up to the provisioned limit go straight to execution with no initialization penalty. If traffic exceeds the provisioned count, the overflow falls back to on-demand instances which still cold start.
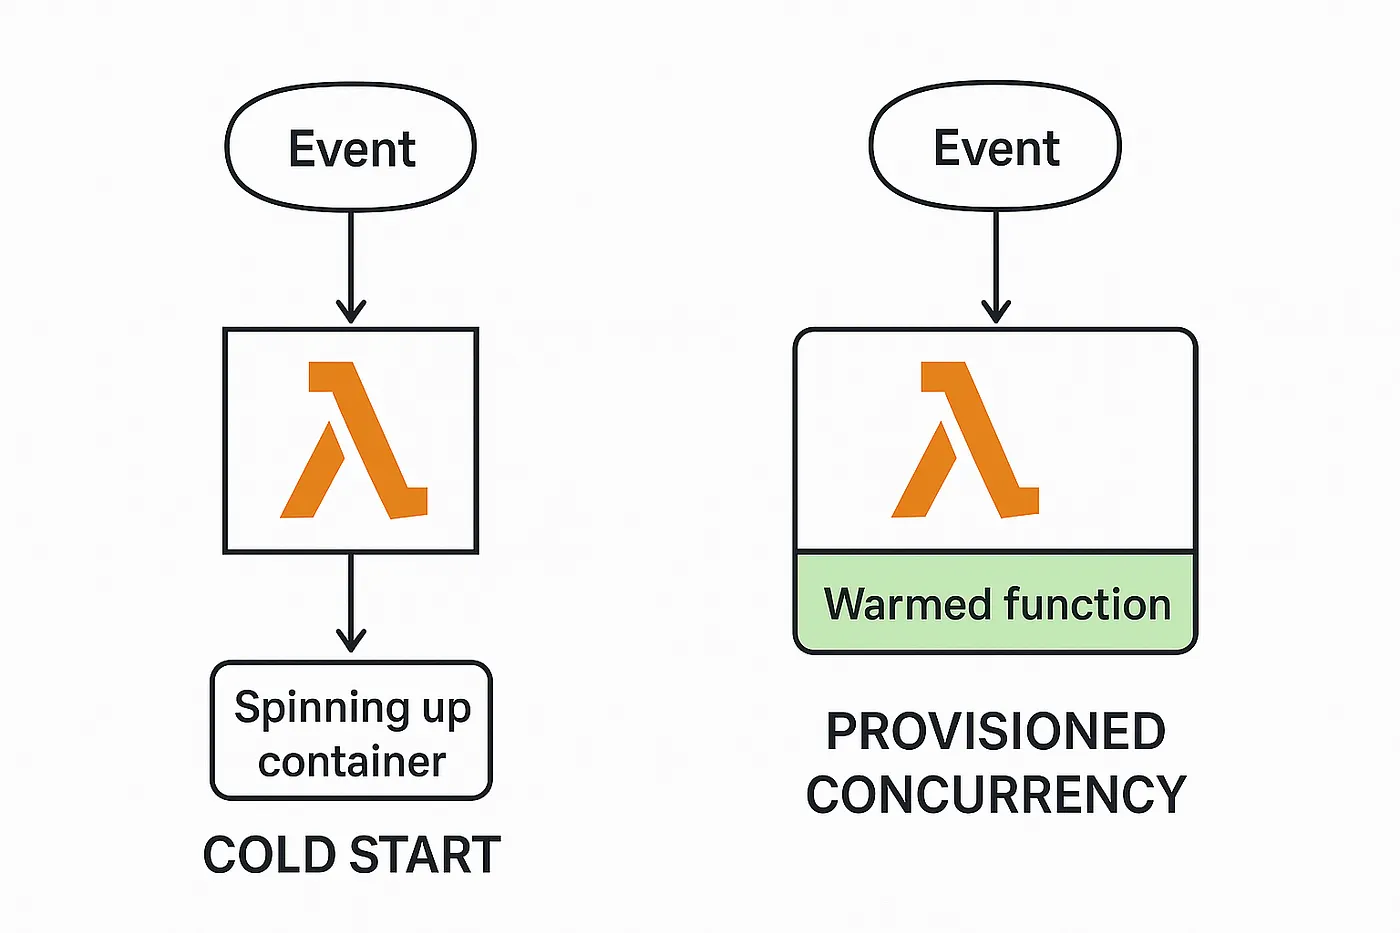
Image by Joseph Schambach
It helps, but it has a blind spot. Prewarming keeps containers alive. It does not change what happens inside a container during initialization. If the module graph takes 600ms to evaluate, every new container, whether spun up by a traffic spike, a deploy, or a scaling event, will pay that 600ms. Provisioned concurrency amortizes the frequency of cold starts. It does not reduce their cost.
The infra optimizations are not wrong. Going from 1.5 seconds to 800ms via provisioned concurrency is real progress. But the remaining 800ms, after all the infrastructure tuning is done, is almost entirely code. That's the part worth fixing.
The call is coming from inside the house.